Graphing TM1 Data Flow
Graphing TM1 Data FlowThis is the new version of genflow.pl a little parser written in perl that will create a input file for graphviz from your TM1 .pro and .rux files then generate a graph of the data flow in your TM1 server...
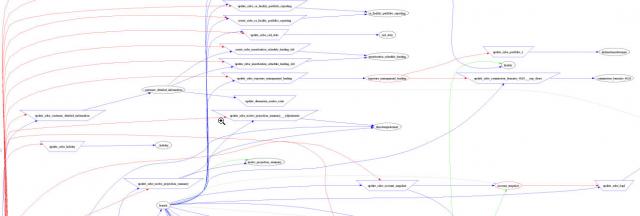
(the image has been cropped and scaled down for display, the original image is actually readable)
Legend
ellipses = cubes, rectangles = processes
red = cellget, blue = cellput, green = inter-cube rule
Procedure to follow:
- Install perl and graphviz
- Put the genflow perl script in any folder, make sure it has the .pl extension (not txt)
- Doubleclick on it
- Enter the path to your TM1 Data folder such as: \\servername\datafolder where \\servername\datafolder is the full file path to your TM1 data folder
- Hit return and wait until the window disappears
- This creates 2 files: "flow.dot" and "flow.gif" in the same folder as the perl script
- Open "flow.gif" in any browser or picture editor
Changelog
1.4:
.display import view names along the edges
.display zeroout views
.sources differentiated by shape
1.3:
.CellPut parsing fix
.cubes/processes names displayed 'as is'
This is still quite experimental but this could be useful to view at a glance high-level interactions between your inputs, processes, cubes and rules.